
Reporting is assembled manually
Teams spend hours copying, combining and checking data.
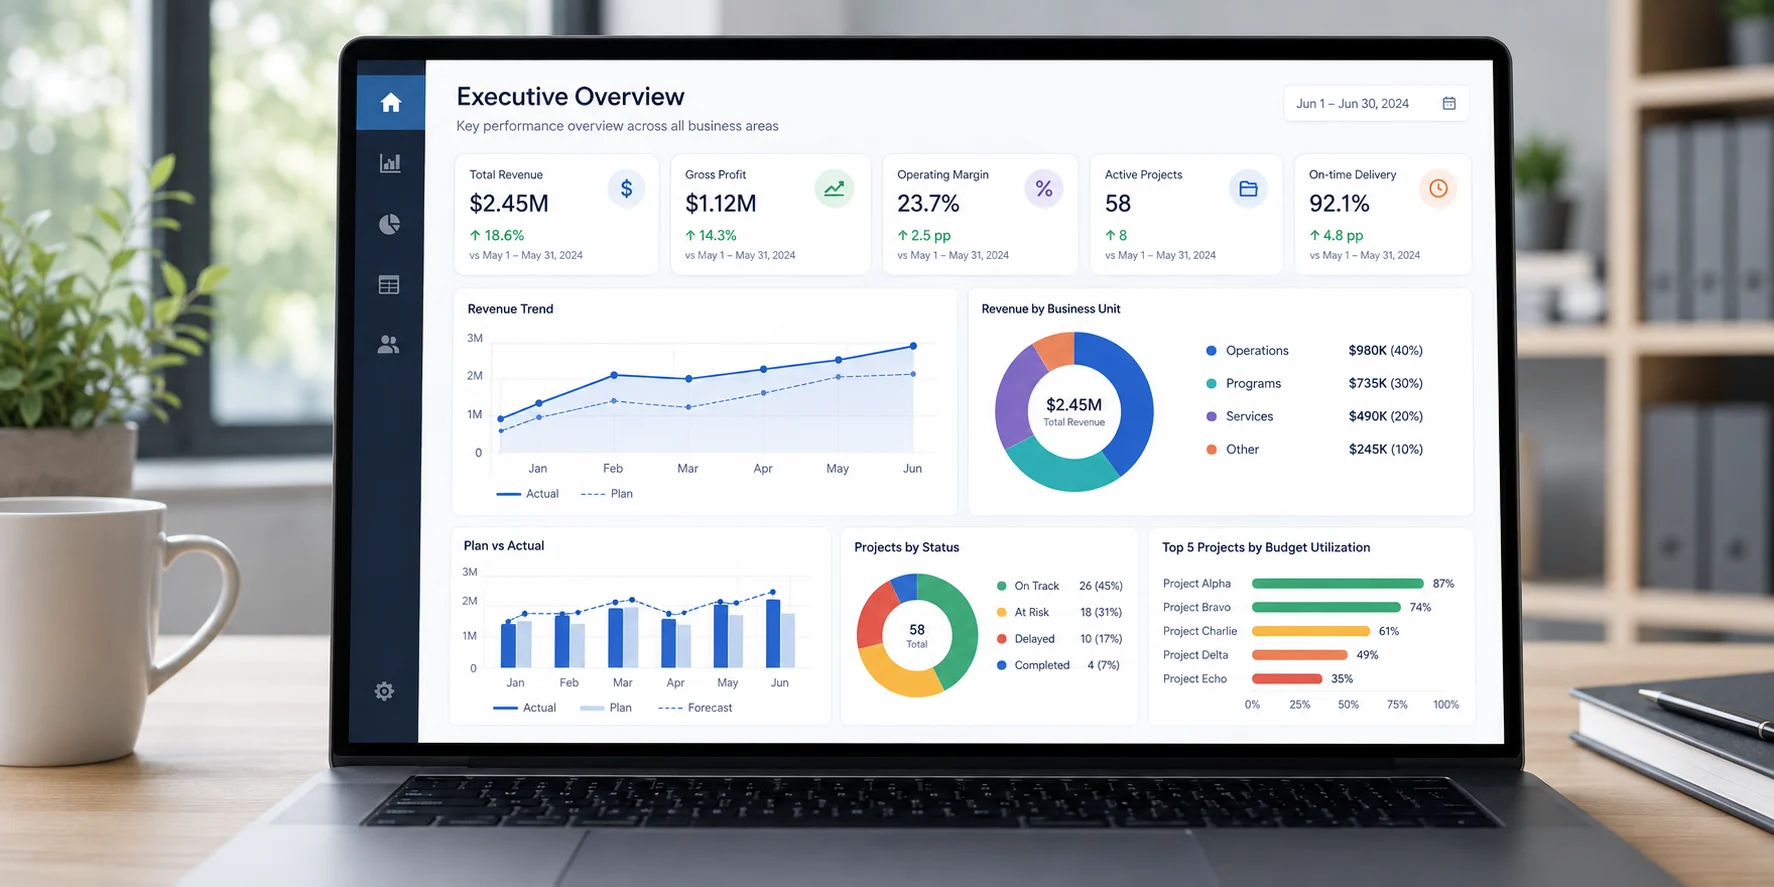
We build analytics systems that consolidate data, expose KPIs and help leaders spot variance, risks and opportunities faster.
Shared metric definitions and calculations.
Leaders see performance without manual report assembly.
Variance and trends are visible before they become problems.
Teams spend hours copying, combining and checking data.
Departments work with different versions of the same metrics.
It is difficult to identify the causes of variance and priorities for action.
Metrics, dimensions, relationships and calculation rules.
Power BI and Looker Studio for operational and management analytics.
Connect sources, consolidate data and refresh it regularly.
KPIs, plan vs actual, trends, risks and metric drill-down.
Define the decisions the report must support.
Align KPIs and calculation rules.
Connect and clean source data.
Build the model, dashboards and drill-down.
Train the team and improve the solution.
Cash flow, plan vs actual, margin and trends in one management view.
Reach, vulnerability, budget and programme KPIs in one view.
We start with the problem, not the technology. We will help define the right approach for your processes, team and data.