
Finance Reporting Dashboard
Revenue, expenses, budgets, cash flow and target-versus-actual for managers.
Package scope is below. Third-party licences and subscriptions are paid separately.

One system for a defined workflow
For organisations and companies needing a recurring financial view without manually assembling reports.
How it works
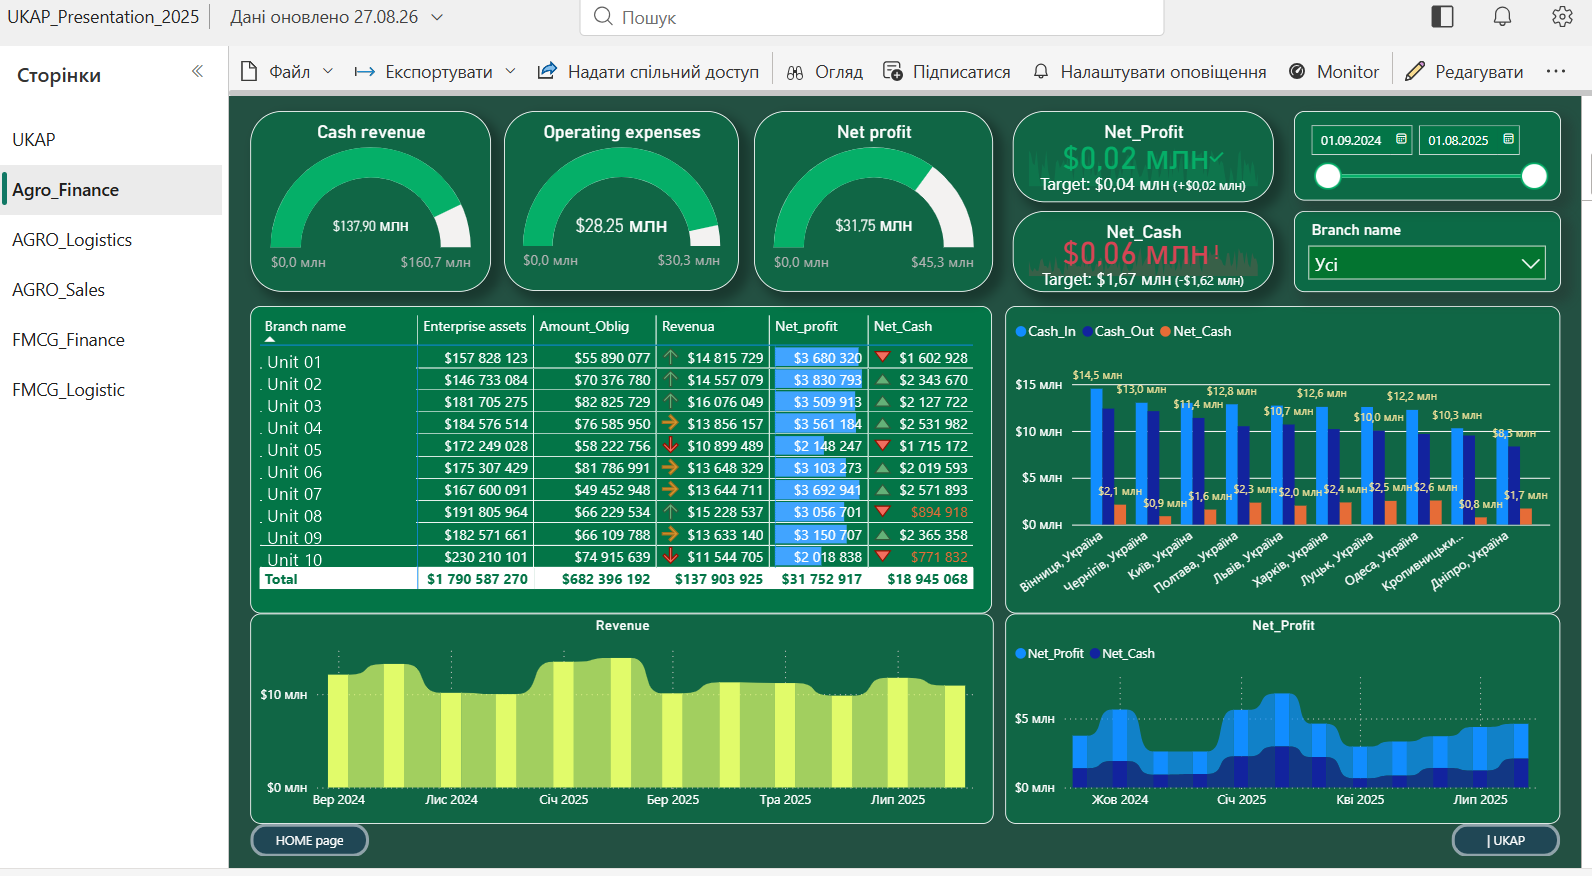
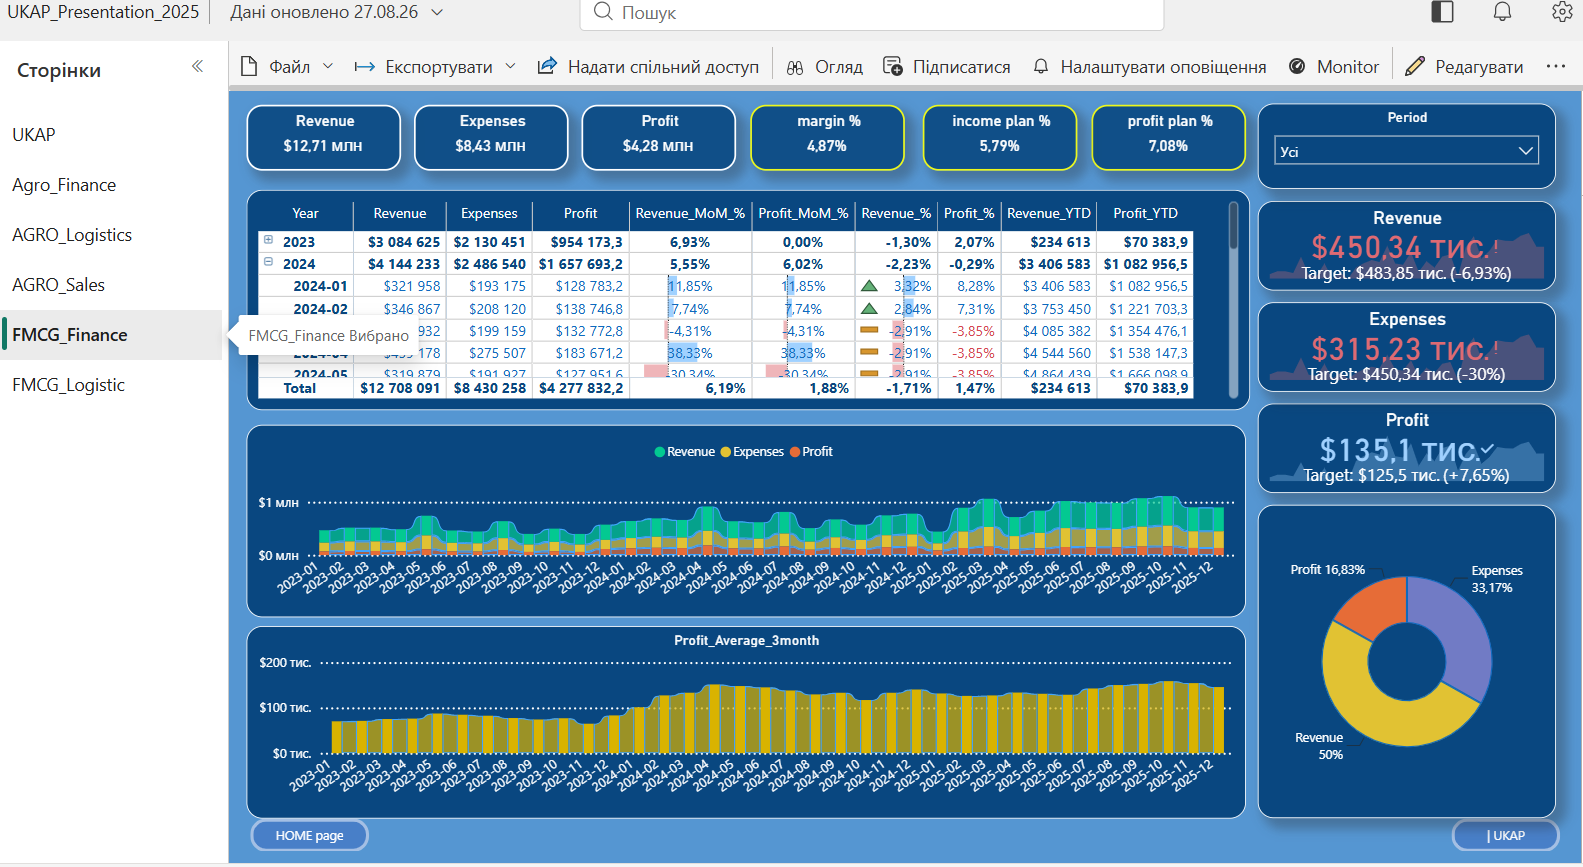
Prepared finance data is categorised and reconciled. In Power BI or Looker Studio, managers select a period and review revenue, expenses, cash flow, budget performance and spend mix.
Tools: Power BI / Looker Studio
What is included for $500
1 legal entity and up to 12 months of data
2 prepared source tables
Basic categories and totals reconciliation
1 two-page dashboard
Filters and short refresh guide
The price covers configuration and handover of this standard package. Paid third-party platform licences are excluded.
Screens and visuals
What we need from your team
Transactions table, budget/plan, category dictionary and period rules.
Multi-industry Power BI example
This public presentation demonstrates UKAP’s analytics approach; the screens and examples above relate to this solution area.
Launch this solution for your team
Revenue, expenses, budgets, cash flow and target-versus-actual for managers.
$500Fixed-price standard package; third-party licences are paid separately.
Need a different scope or several solutions? Complete the detailed brief →
Discuss this solution
Tell us about your organisation. We will contact you about this exact solution.