
Sales Performance Dashboard
Sales plan-versus-actual, managers, products and trends without manual pivots.
Package scope is below. Third-party licences and subscriptions are paid separately.

One system for a defined workflow
For sales leaders and commercial teams monitoring performance against targets.
How it works
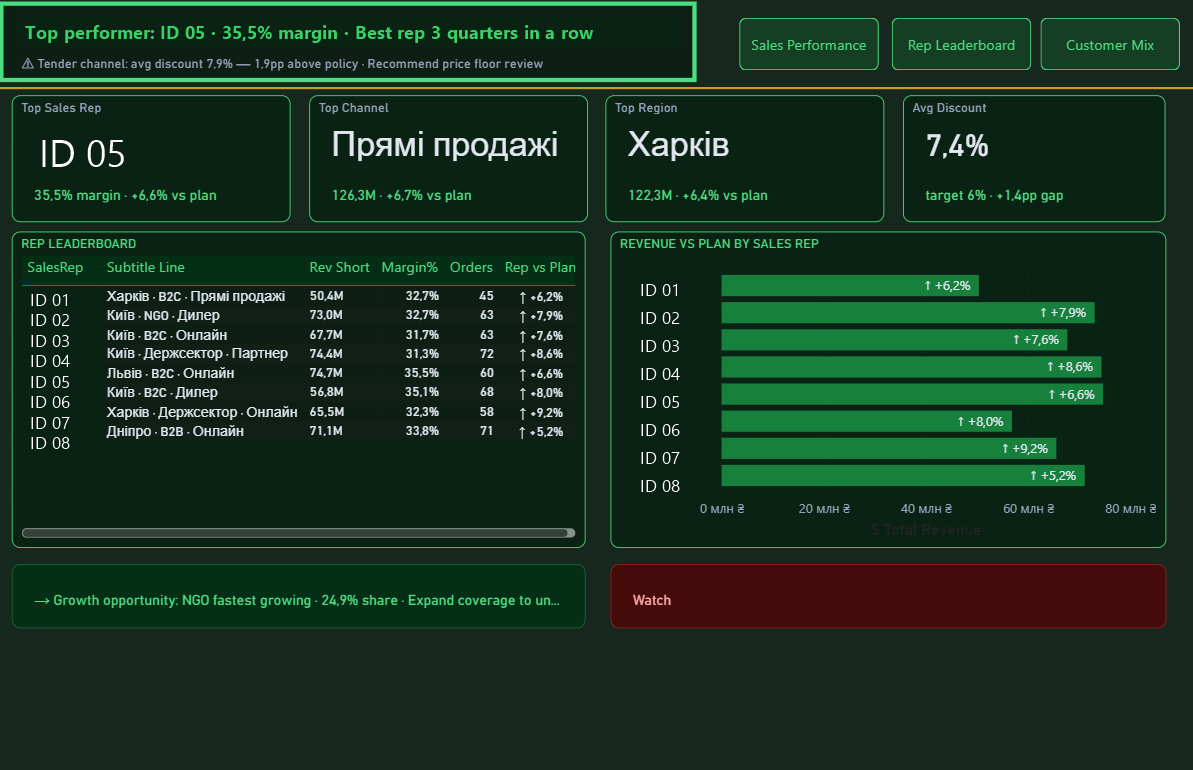
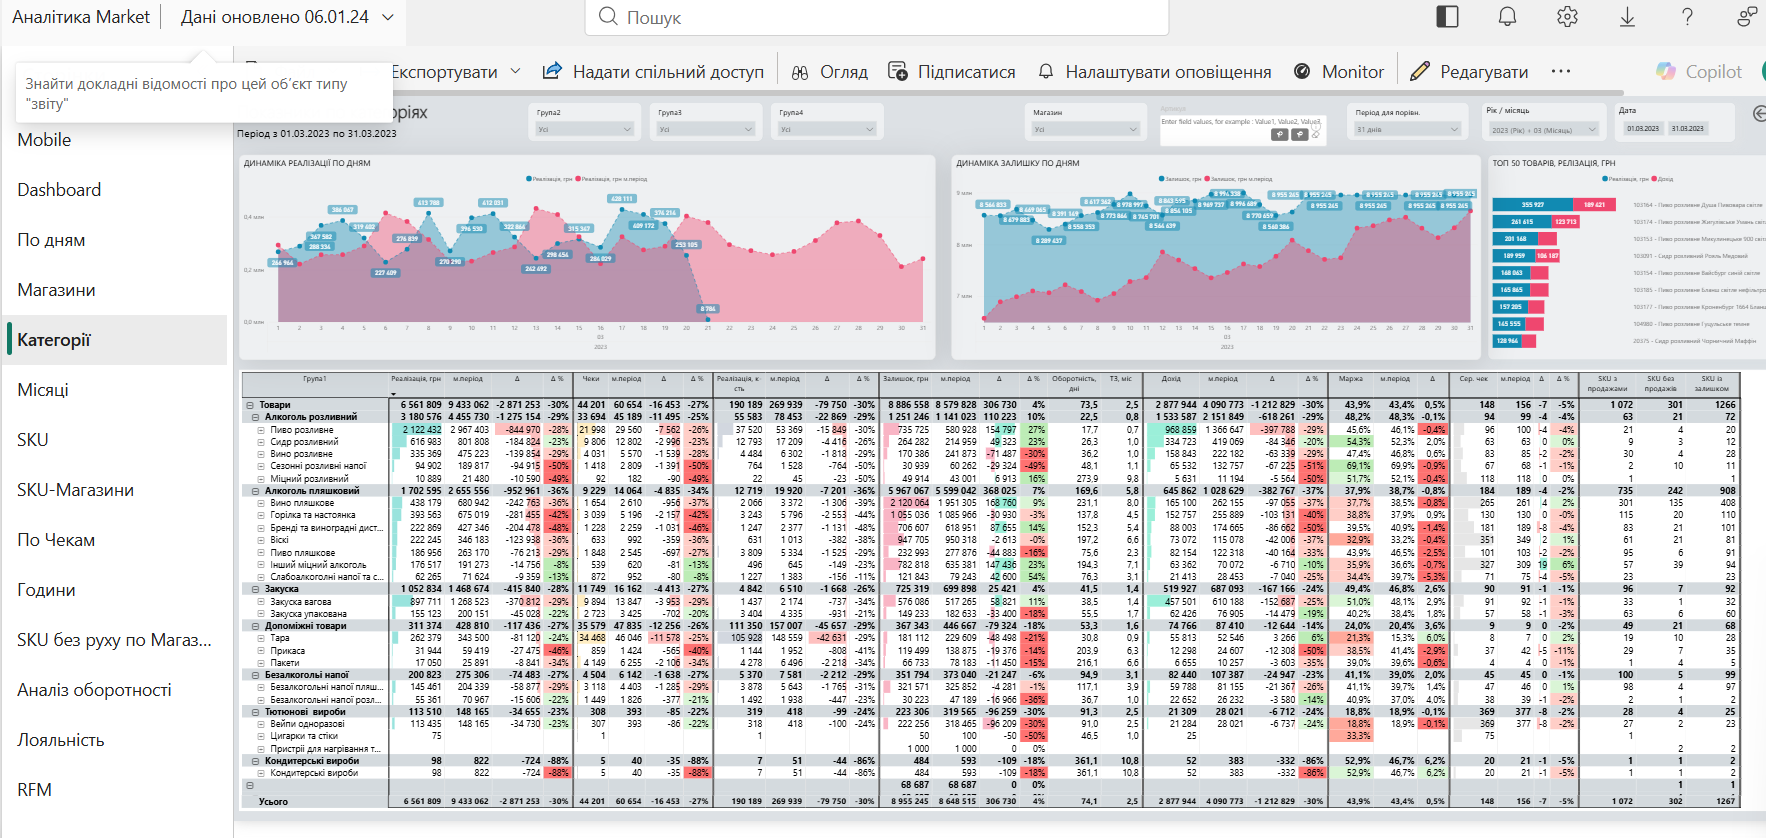
Transactions or orders are combined with the plan, managers and products. The first page shows KPIs and trends; the second drills into owners and items.
Tools: Power BI / Looker Studio
What is included for $500
1 company and up to 12 months of data
2 prepared source tables
1 two-page dashboard
Plan-versus-actual, manager and product analysis
Filters and refresh guide
The price covers configuration and handover of this standard package. Paid third-party platform licences are excluded.
Screens and visuals
What we need from your team
Sales, targets, manager and product dictionaries, and date structure.
Multi-industry Power BI example
This public presentation demonstrates UKAP’s analytics approach; the screens and examples above relate to this solution area.
Launch this solution for your team
Sales plan-versus-actual, managers, products and trends without manual pivots.
$500Fixed-price standard package; third-party licences are paid separately.
Need a different scope or several solutions? Complete the detailed brief →
Discuss this solution
Tell us about your organisation. We will contact you about this exact solution.