Data to Decisions — How to Turn Data into Decisions
Most organizations already have plenty of data. The real challenge is building a process that turns raw records into information and information into decisions.
Most organizations no longer suffer from a lack of data. In fact, they often have too much of it. CRM platforms, Excel files, finance systems, surveys, web analytics, ERP platforms, sales spreadsheets, and recurring reports all generate information.
But more data does not automatically create more understanding. A well-designed process must exist between data and decisions.
Step 1. Start with the question
Analytics should not begin with a dashboard. It should begin with a management question.
For example: Why is margin declining? Which regions are below target? Where is the budget being exceeded? Which product generates the strongest result? Which processes cause delays?
Only then should the organization define the required KPIs and data sources.
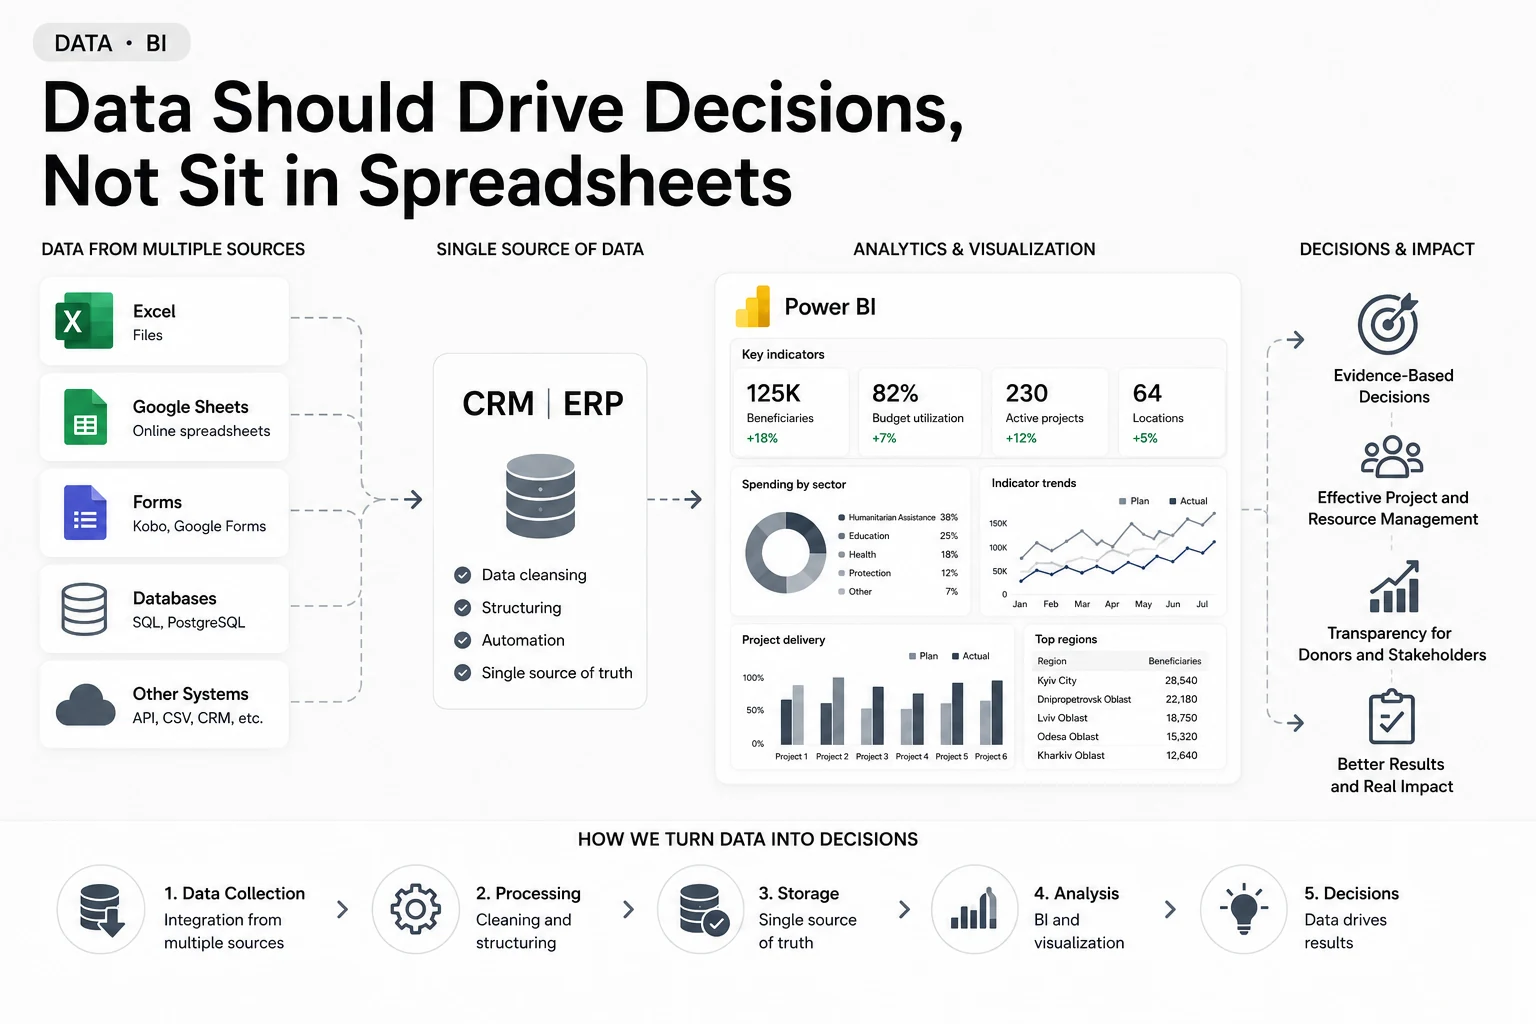
Step 2. Build the data pipeline
Data needs to be Collected → Cleaned → Standardized → Integrated → Validated. This work is often more important than the visual design of the dashboard itself.
Step 3. Add context
A dashboard should not simply display a number. It should show the metric in context: Actual / Target / Previous period / Trend / Cause.
Revenue of 12 million alone tells management very little. A more useful view is: 12M → +8% versus last month → -4% versus target → decline concentrated in two regions.
Step 4. Connect insight to action
Once an issue is identified, the organization should know who owns the issue, what action is required, and when the outcome will be reviewed.
The data cycle then becomes: Data → Insight → Decision → Action → Result.
That transition from information to action is where analytics creates real value.