Dashboard for a CEO: 5 Reasons Why a Dashboard Doesn’t Work
More charts do not automatically mean better management. Here are five common reasons why even a visually impressive executive dashboard fails to support CEO-level decisions.
Dashboard for a CEO: 5 Reasons Why a Dashboard Doesn’t Work
A dashboard can look impressive and still provide very little management value. The reason is simple: a dashboard is not a collection of charts. It is a decision-support tool.
1. There is no clear objective
A common starting question is “What can we visualize?” A better question is: “Which decision should this dashboard help management make?”
A CEO does not need every available metric. They need to understand where the organization stands, what has changed, and where management action is required.
2. The data cannot be trusted
If KPIs are assembled manually from multiple spreadsheets, or different departments define the same metric differently, visualization will not solve the problem.
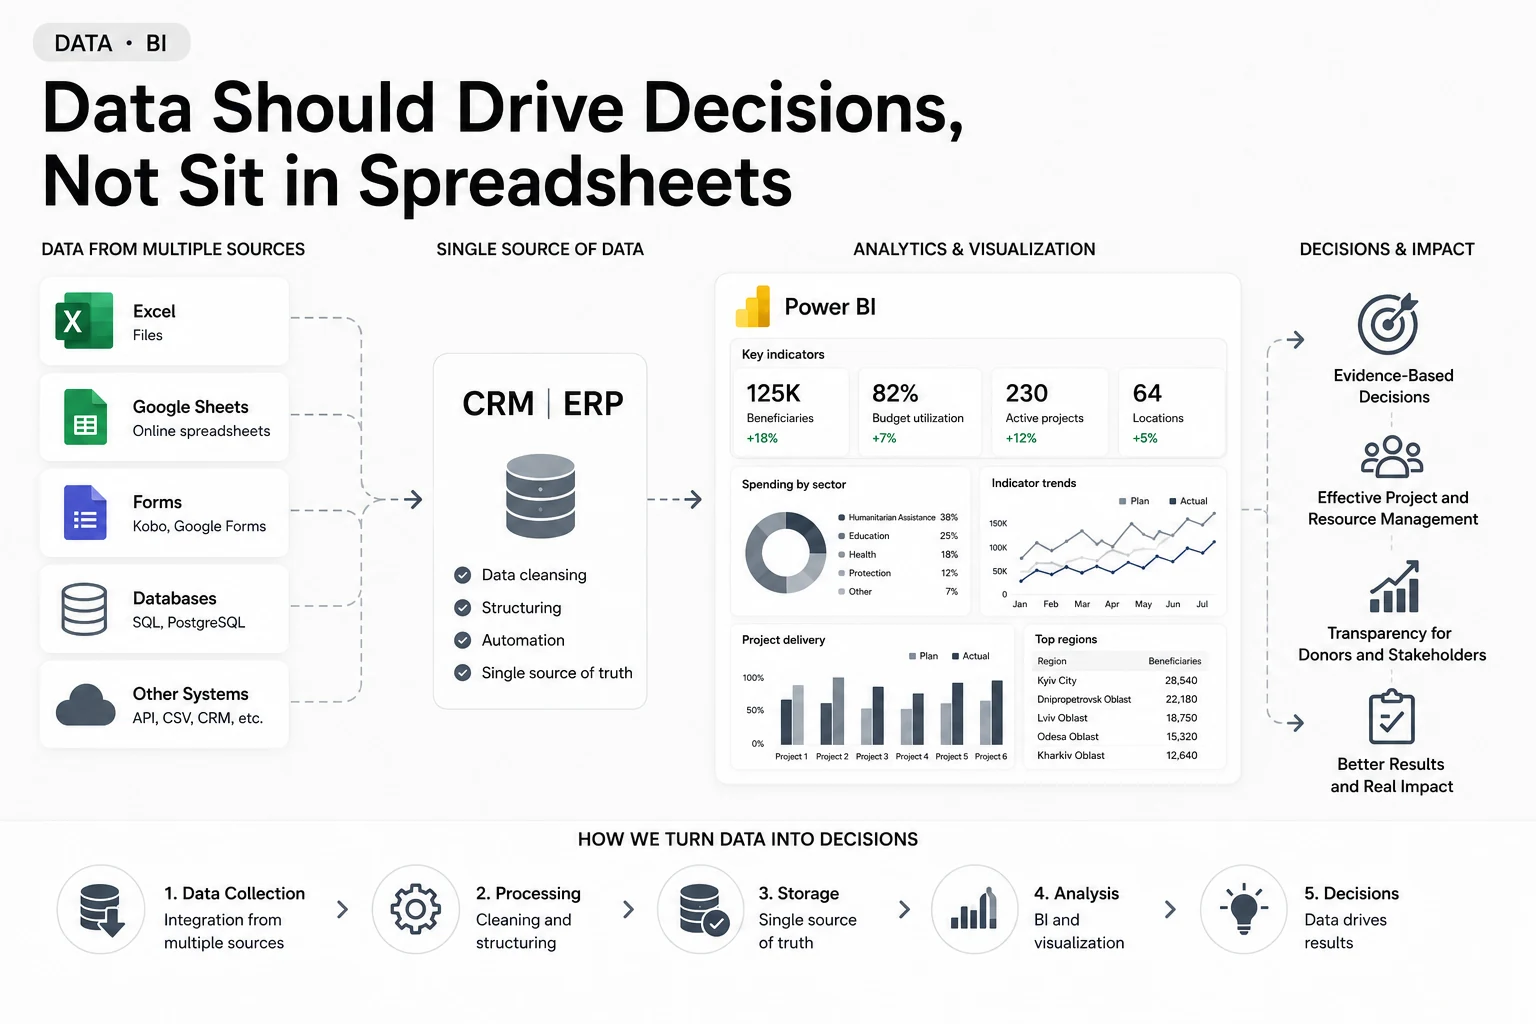
A reliable data layer needs to come first: Sources → Cleansing → Rules → Data model → BI.
3. Information overload
Twenty KPIs, fifteen charts, and dozens of filters may look sophisticated while making the dashboard harder to use. An executive dashboard should follow a much simpler logic: See → Understand → Decide.
4. The information is outdated
A dashboard quickly loses value if somebody has to manually refresh and rebuild it once a month. Operational reporting can often be connected directly to CRM, ERP, SQL databases, spreadsheets, APIs, and other business systems.
5. The dashboard was designed for analysts
Analysts naturally think about dimensions, filters, datasets, and detailed metrics. Executives think about outcomes: revenue, costs, margin, cash flow, productivity, risks, plan versus actual, and forecasts.
The same data therefore needs different levels of presentation for an analyst, department manager, and CEO.
What makes an executive dashboard effective?
A strong dashboard should quickly answer five questions: What is happening? Why is it happening? Where is the problem? What is changing? What decision should we make?
At that point, BI becomes more than visualization. It becomes part of the management system.